Global Chart Talk
Resistance. Support. Entry. Stop Loss. Target Price. Fundamental Analysis. Technical Analysis
Home
Disclaimer: This is my personal stock chart diary and doesn't suggest any trading tips. Due diligence is a must.
My personal trading mantra:
K
eep
I
t
S
imple
S
tupid
Friday, April 24, 2020
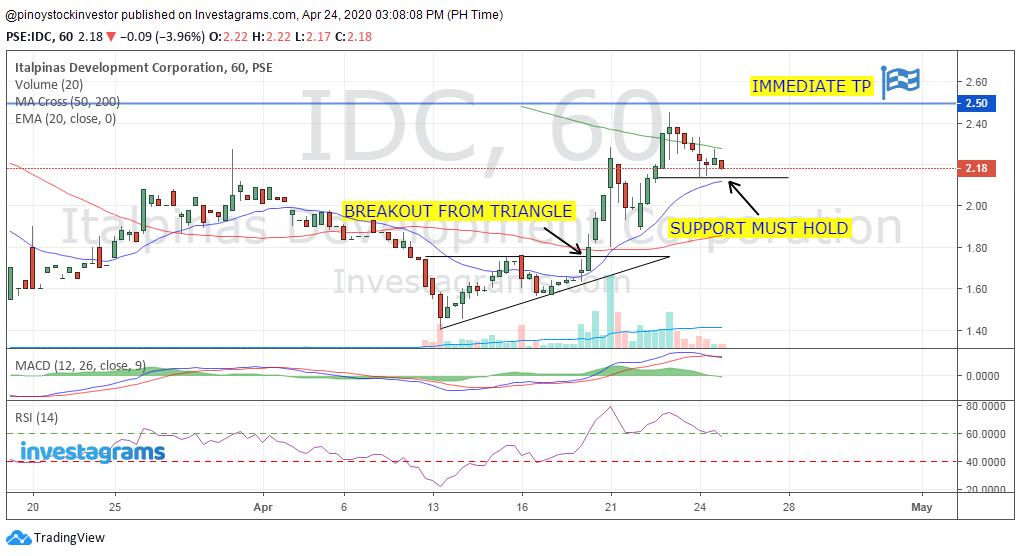
#IDC - Italpinas Development Corporation #ChartAnalysis
1H Chart: Price is moving above the 20EMA/50MA, bias trend is bullish.
Price must hold at 2.13 as support level with immediate target price at 2.50
Though indicators are showing a pause on its upward momentum.
Newer Posts
Older Posts
Home
Subscribe to:
Comments (Atom)