Global Chart Talk
Resistance. Support. Entry. Stop Loss. Target Price. Fundamental Analysis. Technical Analysis
Home
Disclaimer: This is my personal stock chart diary and doesn't suggest any trading tips. Due diligence is a must.
My personal trading mantra:
K
eep
I
t
S
imple
S
tupid
Thursday, July 23, 2020
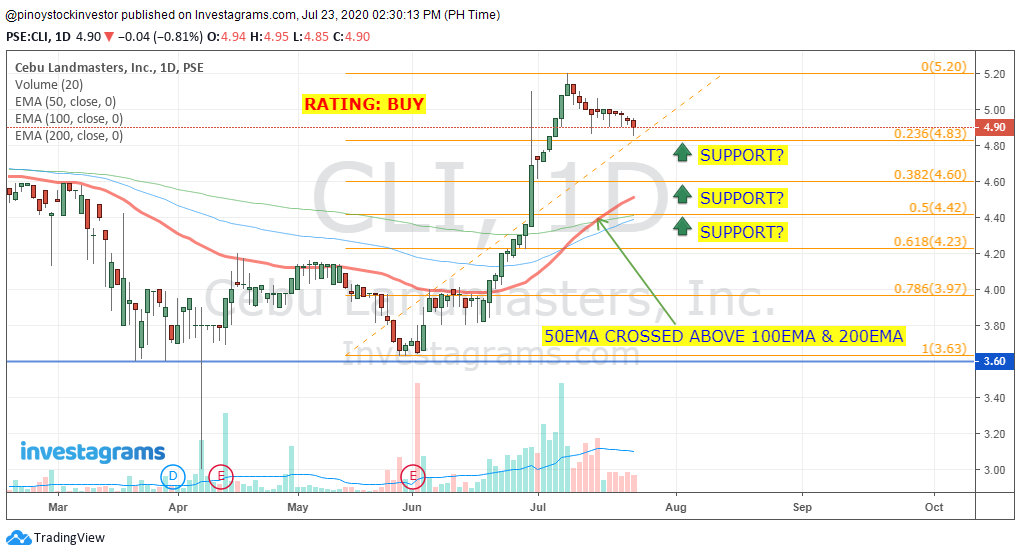
#CLI - Cebu Landmasters, Inc. Financial and Technical Trend Analysis
TECHNICAL
The 50EMA crossed above the 100EMA & 200EMA, a sign of bullishness.
Price peaked and now looking for pullback.
Fib levels are potential support.
Read more »
Wednesday, July 15, 2020
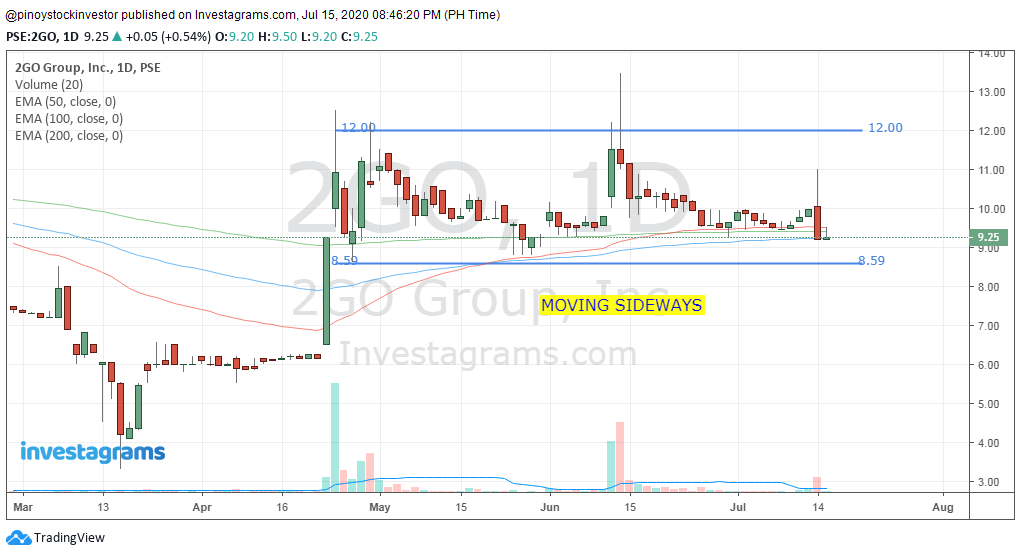
#2GO - 2GO Group, Inc. Financial and Technical Overview Trend Analysis
Currently moving sideways.
Trade range if support will hold at 8.60 level.
Read more »
Wednesday, July 1, 2020
Overview: Fundamentals Technical Chart WLCON - Wilcon Depot, Inc.
TECHNICALS
If the 50% Fib level will act as the new support, immediate resistance is 16.75.
Price failed to stay above the 200EMA and the uptrend channel.
FUNDAMENTALS
Newer Posts
Older Posts
Home
Subscribe to:
Comments (Atom)