TECHNICAL
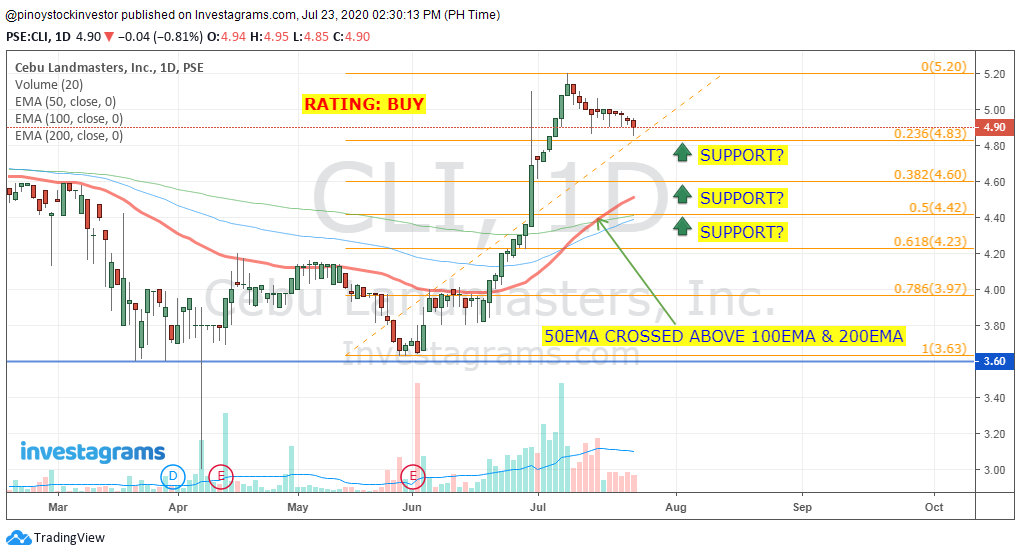
- The 50EMA crossed above the 100EMA & 200EMA, a sign of bullishness.
- Price peaked and now looking for pullback.
- Fib levels are potential support.
FUNDAMENTALS
- Data gathered from Investing.com
- Trend analysis using 2016 as base year.

- Although total revenue is increasing, cost of revenue and operating expenses are also increasing which affects the net income.


No comments:
Post a Comment