Technical Analysis:
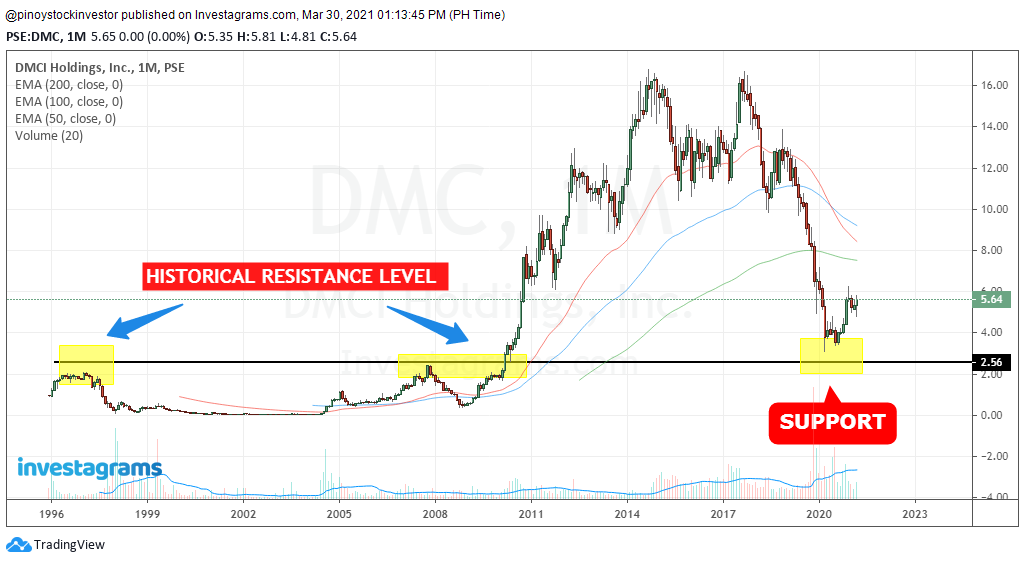
- On monthly chart, this stock has been in downtrend since 2017. Price revisited the historical level at 2.50 and currently bounced that level confirming the new support level.
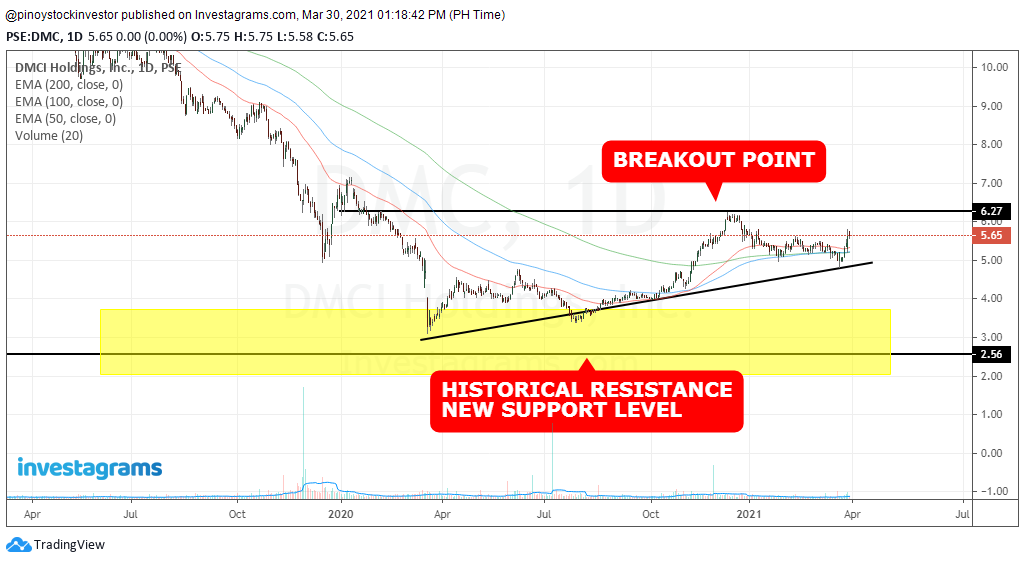
- On daily chart, price movement is showing some reversal as it move above the 50/100/200 moving average. Although the three averages are flat and may continue to move sideways.
- Breakout point is at 6.20 to validate the uptrend movement.
No comments:
Post a Comment