Global Chart Talk
Resistance. Support. Entry. Stop Loss. Target Price. Fundamental Analysis. Technical Analysis
Home
Disclaimer: This is my personal stock chart diary and doesn't suggest any trading tips. Due diligence is a must.
My personal trading mantra:
K
eep
I
t
S
imple
S
tupid
Thursday, April 1, 2021
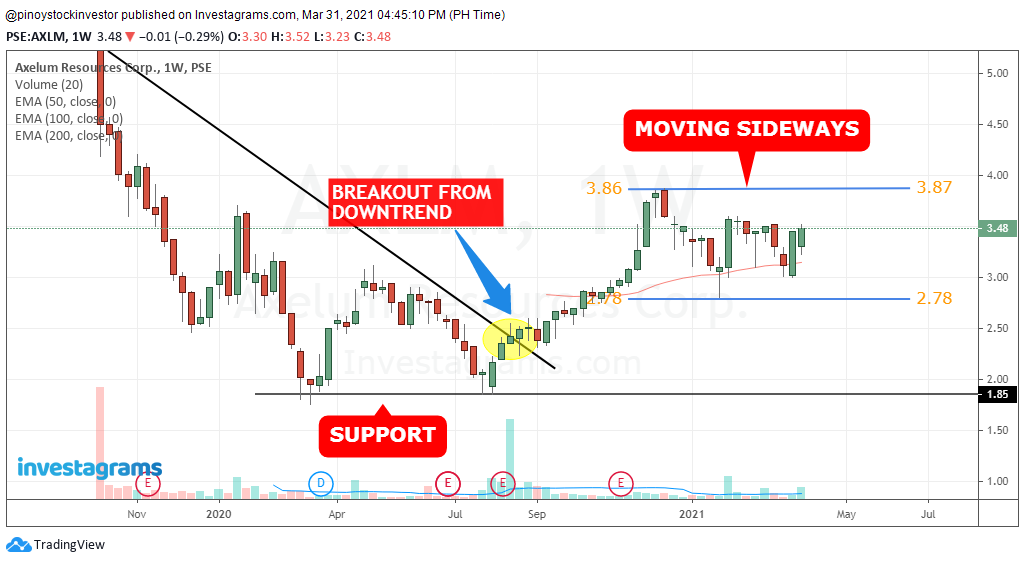
Axelum Resources Corp Stock Technical Fundamental Analysis $AXLM
Technical Analysis:
Price break the downtrend line last August 2020 and is now moving upward.
Ranging between 2.78-3.87
On daily chart, price is above the three moving averages 50/100/200MA.
Fundamental Analysis:
No comments:
Post a Comment
Newer Post
Older Post
Home
Subscribe to:
Post Comments (Atom)
No comments:
Post a Comment